 
       

|
 |


|
|
|
In
order to show its great potentialities for the optimal design of interconnetted pressure networks, SuperNet model was applied to a case certainly interesting, that is the restructuring of New York city's water network.
Recently, the water network of New York city underwent a number of studies to determine its optimal configuration. For this reason it is easy and straightforward to make a direct comparison, under the same application conditions, between the results obtained by our SuperNet model and those published by the most authoritative experts of this sector. Among these the most notable are Lai and Schaake (1969), Quindry and others (1981), Gessler (1982), Morgan and Goulter (1985), Dandy et al. (1996). This comparison shows that SuperNet have reached a configuration of the optimal water network at the lowest cost.
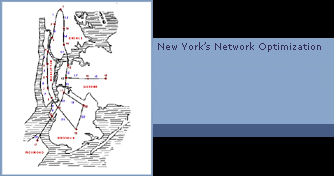
The water network of New York city consists of a system of galleries operating in pressure at gravity, that in 1969 needed to be calibrated in order to meet the increased needs of citizens' demands, realizing a system of galleries in pressure parallel to the already existing one. The project, implemented by Schaake and Lay, sought the solution for an optimal dimensioning able to satisfy the consumption restraints and HGL at the minimum cost of realization.
The solution elaborated by SuperNet model was compared with those obtained, under the same project conditions, by some of the most authoritative experts in the sector, who were able to publish their results because improving the previous ones (Table A).
|
Studio
|
Costo
[U.S. Millioni $]
|
|
Schaake
and Lay (1969)
|
78.1
|
|
Quindry
et al.(1979)
|
63.6
|
|
Gessler
(1982)
|
41.8
|
|
Morgan
and Goulter (1985)
|
38.9
|
|
Dandy
et al. (1996)
|
38.8
|
|
Garzon
(1999)
|
37.9
|
Tab.
A.4
Confronto della soluzione ottenuta con il modello proposto per
il problema dell'espansione della rete idrica della città
di New York con quella ricavata in alcuni studi precedenti, utilizzando,
in ogni caso, dati omogenei sia per quanto riguarda i costi unitari
delle condotte sia per quanto concerne le dimensioni della rete.
|
|
| In the case of SuperNet model the restructuring of New York network costs 38.6 Mils. $ (at 1969 prices). The result is particularly important since it is the most competitive solution ever reached till now, reducing by 0.4 % the previous best result (Dandy et al. (1996)). |
|
| |
|
|
|
| |
|
Application of SuperNet Model
|
|
| The water network of New York city consists of a system of galleries operating in pressure at gravity, that had to be adjusted to be consistent with the modified demand of the city realizing a system of galleries in pressure parallel to existing one with optimal dimensioning. This allowed to satisfy consumption and load constraints at the minimum cost. |
|
| |
|
| |
|
|
Art.
1
|
DN
[mm]
|
K
[]
|
C
[$/m]
|
|
2
|
1219.000
|
100.000
|
439.633
|
|
3
|
1524.000
|
100.000
|
577.428
|
|
4
|
1829.000
|
100.000
|
725.066
|
|
5
|
2134.000
|
100.000
|
875.984
|
|
6
|
2438.000
|
100.000
|
1036.745
|
|
7
|
2743.000
|
100.000
|
1197.507
|
|
8
|
3048.000
|
100.000
|
1368.110
|
|
9
|
3353.000
|
100.000
|
1538.714
|
|
10
|
3658.000
|
100.000
|
1712.598
|
|
11
|
3962.000
|
100.000
|
1893.045
|
|
12
|
4267.000
|
100.000
|
2073.491
|
|
13
|
4572.000
|
100.000
|
2260.499
|
|
14
|
4877.000
|
100.000
|
2447.507
|
|
15
|
5182.000
|
100.000
|
2637.795
|
|
|
| |
|
Tab.
A.1 Set dei materiali utilizzati per realizzare il progetto della
rete dell'acquedotto di New York. La scabrezza è stata
posta, conformemente agli esperimenti effettuati dagli altri ricercatori,
pari a 100 nella formula di Hazen-Williams.
|
|
|
|
| |
|
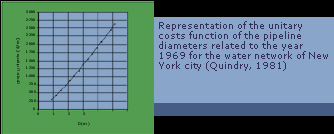
In order to compare SuperNet with results obtained by the above mentioned authors, the original data of New York water network were used, as integrally reported in the article by Quindry (Tab. 1, p. 673, and Tab. 2, p. 674). The unitary costs (Tab. B), expressed in dollars for unity of length, as the galleries diameters vary, correspond to the in relief values in 1969 (Chart 2).
In particular, a friction coefficient K equal to 100 in the formula of Hazen-Williams was applied, being the same value published by Quindry in the said article and, obviously, by all the other researchers. |
|
| |
|
 |
|
| |
|
| |
|
Calculated Results Analysis
|
|
In the project of New York city network restructuring, along every existing major pipeline a project pipeline was placed. During the optimization phase the model eliminates superfluous pipelines, reduces the exuberant pipelines and enlarges those having an insufficient diameter.
The
procedure of pipeline elimination was implemented checking that connections considered as superfluous do not induce in the system, after their elimination, an increase of the general cost of the network or an unacceptable solution in a hydraulic perspective.
The process of optimization ends only when the percentage saving for the network results negligible. Thanks to the particular structure of the model, the final solution is consistent both from the hydraulic point of view and, at the same time, at the lowest cost.
The model allows considering at the same time all the manifold load conditions foreseen by the planner (network functioning in condition of maximum or minimum consumption, pipelines break-ups, fireproof alarms, etc.).
In the case of the extension of New York city water network, the load condition was only taken into account as reported in literature (Quindry et al. (1979)).
|
|
| |
|
| Table 3 compares loads calculated by SuperNet hydrodynamic model with load constraints as required by the planner. |
|
| |
|
|
Node
|
d
|
a
|
HGL
(m)
|
a
|
|
a
|
Calcolato
|
Minimo
|
Massimo
|
Eguale
|
|
2
|
89.798
|
77.724
|
-
|
-
|
|
3
|
87.541
|
77.724
|
-
|
-
|
|
4
|
86.887
|
77.724
|
-
|
-
|
|
5
|
86.315
|
77.724
|
-
|
-
|
|
6
|
85.879
|
77.724
|
-
|
-
|
|
7
|
85.208
|
77.724
|
-
|
-
|
|
8
|
84.242
|
77.724
|
-
|
-
|
|
9
|
83.560
|
77.724
|
-
|
-
|
|
10
|
83.550
|
77.724
|
-
|
-
|
|
11
|
83.617
|
77.724
|
-
|
-
|
|
12
|
84.051
|
77.724
|
-
|
-
|
|
13
|
85.011
|
77.724
|
-
|
-
|
|
14
|
87.411
|
77.724
|
-
|
-
|
|
15
|
89.893
|
77.724
|
-
|
-
|
|
16
|
79.249
|
79.248
|
-
|
-
|
|
17
|
83.149
|
83.149
|
-
|
-
|
|
18
|
79.830
|
77.724
|
-
|
-
|
|
19
|
77.724
|
77.724
|
-
|
-
|
|
20
|
77.723
|
77.724
|
-
|
-
|
|
|
| |
|
Tab.
A.2 Confronto tra i valori di pressione calcolati e imposti
come condizione di vincolo nel caso della rete. I valori sono
gli stessi di quelli utilizzati dagli altri ricercatori.
|
|
| |
|
| Table 4 finally reports the optimization results for the solution of the problem to upgrade New York network. |
|
| |
|
|
Link
|
Elem.
|
DN
[mm]
|
L
[m]
|
Costo
Unit. [$/m]
|
Costo
[$]
|
|
15
|
15
|
3048.000
|
257.37
|
1368.110
|
352106.300
|
|
1
|
52
|
2743.000
|
4467.03
|
1197.507
|
5349305.000
|
|
16
|
16
|
2134.000
|
8046.72
|
875.984
|
7048799.000
|
|
17
|
17
|
2438.000
|
9509.76
|
1036.745
|
9859197.000
|
|
18
|
18
|
2134.000
|
5993.40
|
875.984
|
5250125.000
|
|
1
|
64
|
1829.000
|
1321.80
|
725.066
|
958389.700
|
|
19
|
19
|
1524.000
|
2676.58
|
577.428
|
1545533.000
|
|
1
|
61
|
1219.000
|
1712.54
|
439.633
|
752888.800
|
|
21
|
21
|
2134.000
|
6383.13
|
875.984
|
5591523.000
|
|
1
|
60
|
1829.000
|
1663.59
|
725.066
|
1206210.000
|
|
|
| |
|
Tab.
A.3 - Soluzione determinata con il modello
di ottimizzazione per il problema dell'espansione della rete idrica
della città di New York
|
|
| |
|
|
|
|


|